in 1996
repeat business
websites
MOBILE
CROSS
customers
React Portfolio
This project is basically an Artificial Intelligence system for people management tool that uses data analytics, machine learning and proprietary algorithms to produce valuable predictions for business leaders, managers, employees and candidates. X0PA focuses on building value through predictive and artificial intelligence capabilities within the field of People Operations.
Domain
Public Sector
Stack
Frontend: HTML5, JavaScript, Reactjs.
Backend: Node.js.
OS: MAC OS.
Third Party Components: Google Charts.
Key Highlight (s)
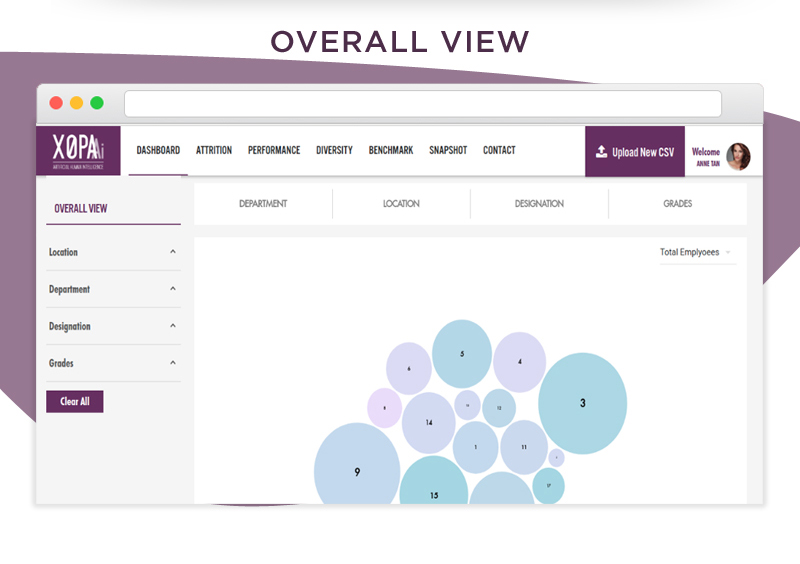
Dashboard Tab:
-
Visualize based on Department, Location, Designation and Grades category. Data is represented in bubble format using react-bubble-chart plugins.
-
When click on the bubble will redirect to snapshot and display data based on the option selected in the dashboard tab. When you click on to go back, it will be redirected back to the Dashboard tab with all the field set as before.
-
The side navigation has filters based on Location, Department, Designation and Grade. the side nav can have only five items list on each category and have added more options on each section to add one filter at a time using autocomplete search function on the remaining list of items.
-
It also has clear all option to clear all filters.
Attrition predictor Tab:
-
It will give predictions about resignations and recruitments in the next 12 months.
-
Similar to the Dashboard, with default modal open showing high-risk individual data. filtering and data visualization is similar to the dashboard.
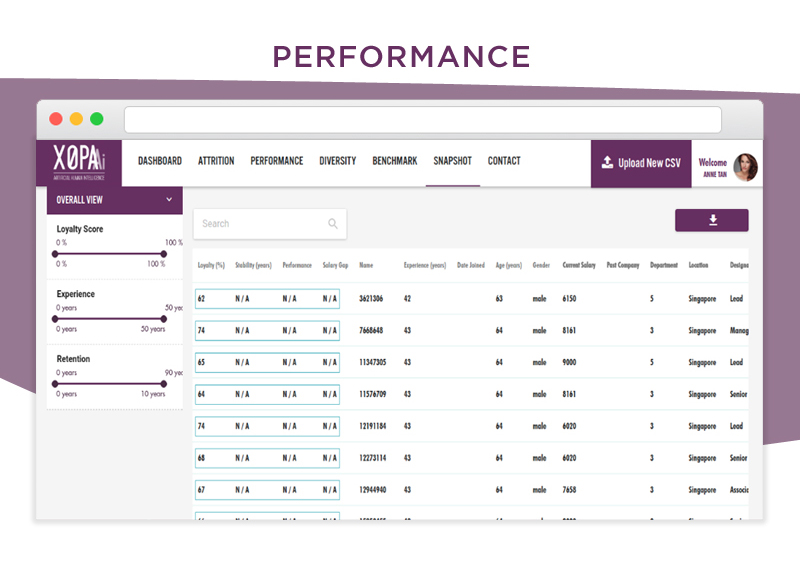
SnapShot Tab:
-
Listing of all Employees data. We can also filter the list based on Loyalty score, Experience and Retention. We have to use modal to display candidate information. the information is stored in the 3D carousel.
Diversity Tab:
-
Used google geo chart for data visualization. Here we visualize data based on employment ratio, gender, total employment of each country. Shows information in tooltip on hover.
Benchmark Tab:
-
Visualize data based on Company average and Industry average.
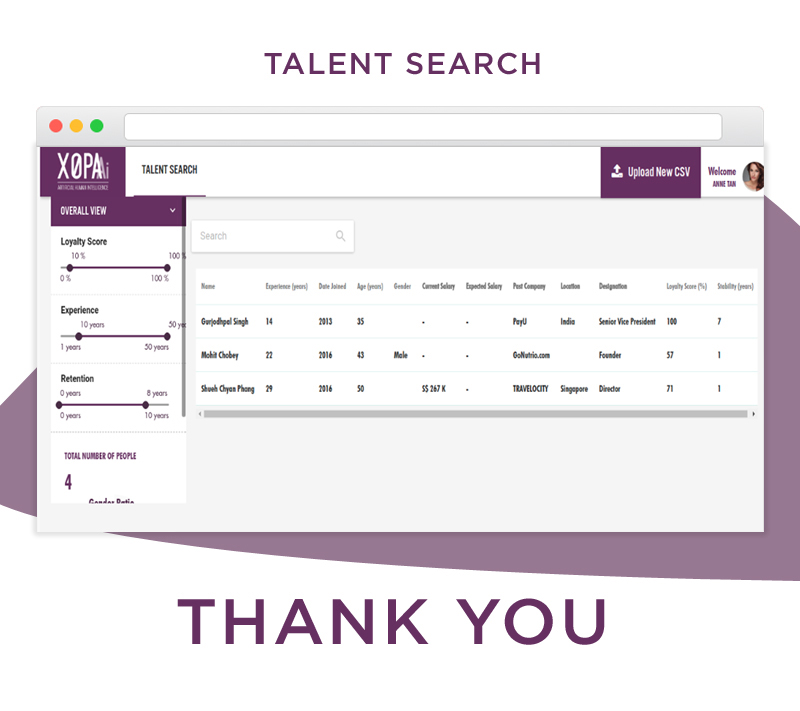
Talent Search:
-
It will contain all the information like a snapshot but for only new candidates.